How Sparlift calculates muscle recovery time
The open model behind Sparlift's recovery map: hard sets from reps in reserve, a recovery clock in hours for each muscle, and whole-body training load. Formulas, sources, a real week.
A muscle trained with about three sets taken to failure needs roughly 48 hours before it performs at its best again. Quads and hamstrings need about 60 hours; small muscles such as calves, forearms and abs about 36. Sparlift turns every set you tick into a fraction of a set to failure, adds those fractions up per muscle, and runs a recovery clock in hours for each of 14 muscles. A second read-out compares your whole-body training load of the last two days with your own last three weeks.
Everything is inferred from the log. The app never asks how you slept or how hard a session felt. This page gives every formula and the evidence behind it, with a worked example from a real training week.
Summary
- Effort, not load, drives recovery time. A set's effort is how close to failure it was: taken from the reps in reserve (RIR) you logged, or estimated against your own best set of the last 8 weeks.
- Hard sets. Effort becomes a hard-set value between 0 and 1 — nothing at half effort, 1 at failure. A muscle gets the full value from exercises where it is a main mover and half from exercises where it assists.
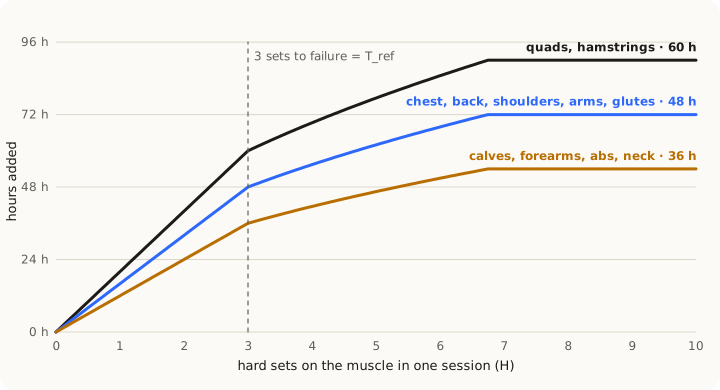
- Hours. Three hard sets leave a muscle its reference time, T_ref: 36, 48 or 60 hours. More sets add less and less, up to 1.5 × T_ref from one session.
- A clock that adds up. Sessions on a muscle that hasn't recovered stack, up to 2.5 × T_ref. The clock counts down one hour per hour and wears the oldest session off first.
- Whole-body load. Session effort × minutes, averaged over 48 hours and compared with a 21-day average: your usual always reads 50.
Recovery time by muscle group
T_ref is the recovery time after about three sets taken to failure. One session can leave at most 1.5 × T_ref; sessions stacked on an unrecovered muscle, at most 2.5 × T_ref.
| Muscle | T_ref (≈ 3 sets to failure) | Most from one session | Most on the clock |
|---|---|---|---|
| Quads, hamstrings | 60 h | 90 h | 150 h |
| Chest, back & traps, shoulders, glutes, biceps, triceps | 48 h | 72 h | 120 h |
| Calves, forearms, abs, obliques, hips & adductors, neck | 36 h | 54 h | 90 h |
Where the numbers come from. Three sets of ten taken to failure in the bench press and the squat kept mechanical performance down until about 48 hours, while the same repetitions stopped short of failure recovered much faster (Morán-Navarro et al., 2017). Eight sets of ten left strength deficits for up to 72 hours; eight heavy sets of three, for 24 (Bartolomei et al., 2017) — hence the session cap of 1.5 × 48 h. Single-joint arm exercises caused larger strength losses and longer soreness than multi-joint ones (Soares et al., 2015), so biceps and triceps sit at 48 h rather than 36. The leg and small-muscle values are extrapolations from those findings, not measured directly.
Step 1 — how hard was each set
Each working set gets an effort q between 0 and 1, where 1 means the set was taken to failure. Warm-up sets and sets you didn't tick are ignored.
RIR logged (or RPE, as RIR = 10 − RPE):  q = reps / (reps + RIR)
No RIR, a best set in the last 8 weeks:  q = reps / possible
                                         possible = 30 × (e1RM_best / weight − 1) + RIR_best
No RIR and no history:                   q = 1   (assumed taken to failure)
Heavy sets (weight ≥ 85% of e1RM_best):  q ≥ weight / e1RM_best − 0.1
possible inverts the Epley formula for the estimated one-rep max: the reps your best set says you could do
at this weight. RIR_best is the RIR you logged on that best set, or 1 if you didn't — most lifters stop a rep or
two short of true failure, so an unmarked best set is assumed to have had one rep left. The heavy-set floor exists
because a set at 90% of your best is never far from failure, whatever the arithmetic says.
RIR is the best input. The RIR-based RPE scale is well validated in experienced lifters (Zourdos et al., 2016; Helms et al., 2016). Predictions aren't perfect: across studies, lifters under-estimated their remaining reps by about one on average, and got a little better close to failure (Halperin et al., 2022). Logging RIR 0 on the set you took to failure also sharpens every other set of that exercise, because that set becomes the yardstick.
Step 2 — the hard-set value
h = clamp((q − 0.5) / 0.5, 0, 1) ^ 1.5
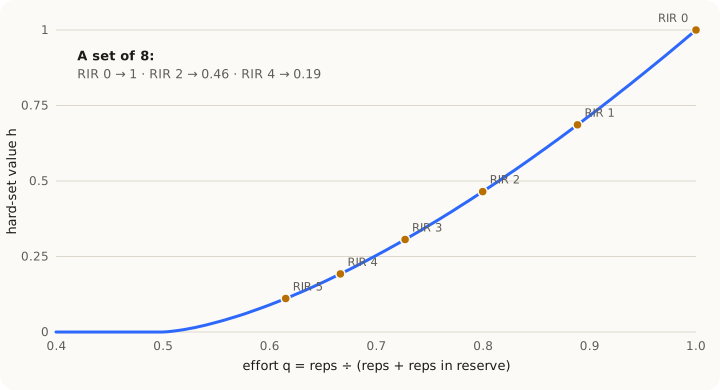
| Effort q | 0.5 | 0.6 | 0.7 | 0.8 | 0.9 | 1.0 |
|---|---|---|---|---|---|---|
| Hard-set value h | 0 | 0.089 | 0.253 | 0.465 | 0.716 | 1 |
The shape follows the evidence that proximity to failure, more than the load itself, sets how long recovery takes. Squats at 80% of 1RM stopped far from failure (20% velocity loss) recovered within about 24 hours, while sets carried close to failure recovered slowest (Pareja-Blanco et al., 2019).
Step 3 — hard sets per muscle
H(muscle) = Σ h × role role = 1 for a main mover, 0.5 for an assisting muscle
- Joints and tendons. A heavy multi-joint lift counts × 1.25 on its main movers when one of its sets reaches 80% or more of your best. "Heavy multi-joint" means a systemic load of 0.5 or more in the exercise catalogue: deadlift (1.0), back squat (0.9), bench press (0.7), overhead press and barbell row (0.6), pull-up (0.5). Tendon collagen synthesis peaks about 24 hours after exercise and is still raised at 72 (Miller et al., 2005).
- One-arm and one-leg exercises. A left/right pair at the same position is one set for the muscle; the harder side counts.
Step 4 — from hard sets to hours
D = T_ref × v(H)
v(H) = H / 3                  for H ≤ 3
v(H) = min(1.5, √(H / 3))     for H > 3
Step 5 — the recovery clock
Each muscle has a clock in hours. It counts down one hour per hour, and a new session adds its debt D on top of whatever is left, up to 2.5 × T_ref. A second session on a muscle isn't discounted: the repeated-bout effect that would justify a discount was absent in resistance-trained men (Falvo et al., 2008).
The clock keeps each session's hours as a separate part and wears the oldest part off first — it arrived first. The parts left always add up to the clock, which is what the app shows when you open a muscle: the sessions behind its hours, with the exercises and the sets that counted.
Light touches. A session that leaves a muscle less than 15% of T_ref — for the back, a couple of face pulls where it only assists — still adds its hours, but it isn't counted as the last time you trained that muscle.
Step 6 — states and "ready in"
| Hours left ÷ T_ref | State | What it means |
|---|---|---|
| under 0.15 | Fresh | Ready to train |
| 0.15 to under 0.5 | Recovering | Almost ready |
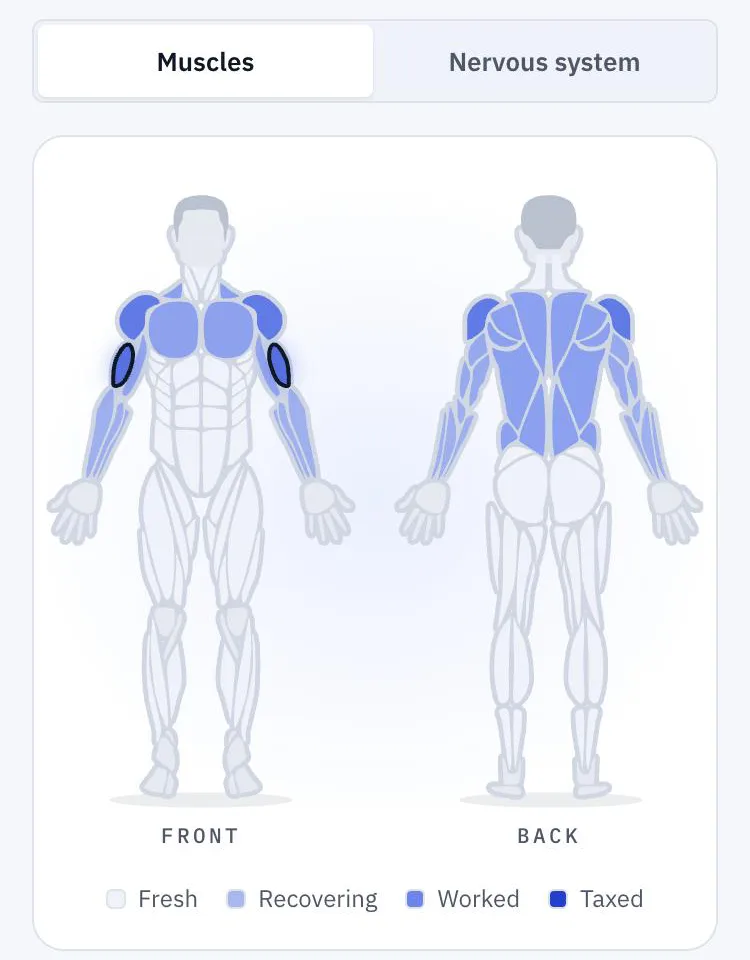
| 0.5 to 1.25 | Worked | About one normal hard session's worth |
| over 1.25 to 1.5 | Taxed | As much as one session can leave |
| over 1.5 | Overreached | Sessions stacked on an unrecovered muscle |
Ready in = hours left − 0.15 × T_ref: the time until the muscle reads Fresh. The app shows it in whole hours; the sessions behind a muscle split that number in proportion to what each still has on the clock (largest remainder, so the parts add up exactly).
Combat sports: rounds and classes
Rounds and timed blocks — pads, bag work, sparring, clinch, grappling rolls — aren't sets. Every 3 minutes count as a fraction of a hard set on the muscles the activity uses:
H = Σ (minutes / 3) × 0.4 × h(RPE / 10) one class leaves at most 1 × T_ref
RPE is the one you logged for the rounds, else the activity's default: 3 + 5 × its systemic load, which gives about 7.5 for sparring, 6 for pads and bag, 6.5 for clinch and 4.5 for shadowboxing. Those defaults sit where MMA athletes put the same activities: sparring at RPE 7 or more, striking and grappling drills at 4 or less (Kirk et al., 2021).
Logged effort changes a lot. A kickboxing class in the catalogue's shape — rope, shadowboxing, 20 minutes of technique, five pad rounds, three bag rounds and two clinch rounds — adds about 5 hours to the shoulders at the default effort, but with pads and bag logged at RPE 8 it adds:
| Muscle | Hours added |
|---|---|
| Shoulders | 23.8 |
| Obliques | 17.8 |
| Triceps | 11.9 |
| Calves | 8.9 |
| Hips & adductors, neck, back, abs | 1–2.5 each |
Worked example: a real training week
The example is the author's own log: a push/pull split lifted four to six days a week, logged in Sparlift with the sets ticked as they were done. It covers the evening of Tuesday 29 September 2026, after a pull day logged on Monday night and a push day on Tuesday.
The push day, set by set
Only two sets carried a logged RIR. The rest were judged against the lifter's best set of each exercise in the previous 8 weeks.
| Exercise | Sets → effort q → hard-set value h | Hard sets |
|---|---|---|
| Overhead press | 50×4 q 0.37 → 0 · 55×6 RIR 0 → 1 · 55×6 q 0.83 → 0.52 | 1.52 |
| Rear delt fly (cable) | 3×12 q 0.24 → 0 · 3×12 → 0 | 0 |
| Face pull | 15×12 q 0.56 → 0.04 · 15×15 q 0.70 → 0.25 | 0.30 |
| Incline press (Smith) | 85×6 q 0.86 → 0.60 · 85×6 → 0.60 · 85×7 RIR 0 → 1 | 2.21 |
| Single-arm preacher curl | 20×5 / 20×5 → 0.12 · 20×6 / 20×5 → 0.35 (left/right pairs) | 0.48 × 1.25* |
| Lateral raise | 14×14 q 0.74 → 0.33 · 14×14 → 0.33 | 0.65 |
* The preacher curl in this log is a user-created exercise with a systemic load of 0.5, so the heavy-lift factor applies to it.
Two things stand out. The second overhead-press set of 55×6, identical to the first, counts 0.52 instead of 1 because it had no RIR: it was judged against a best set with an assumed rep in reserve. And the rear-delt flies count nothing, because the lifter's best on that cable is far heavier than 3 kg for 12.
| Muscle | Hard sets H | Hours from this session |
|---|---|---|
| Shoulders | 3.58 | 52.4 |
| Chest | 2.21 | 35.3 |
| Triceps | 1.87 | 29.9 |
| Biceps | 0.60 | 9.6 |
| Forearms | 0.24 | 2.9 (a light touch) |
| Back & traps | 0.15 | 2.4 (a light touch) |
The pull day the evening before — seated and single-arm cable rows, single-arm preacher curls, hammer curls — put 4.95 hard sets and 61.6 hours on the biceps, 2.96 hard sets and 47.4 hours on the back, and 28 hours on the forearms.
The clocks on Tuesday evening
| Muscle | Hours left | State | Ready in | Where the hours came from |
|---|---|---|---|---|
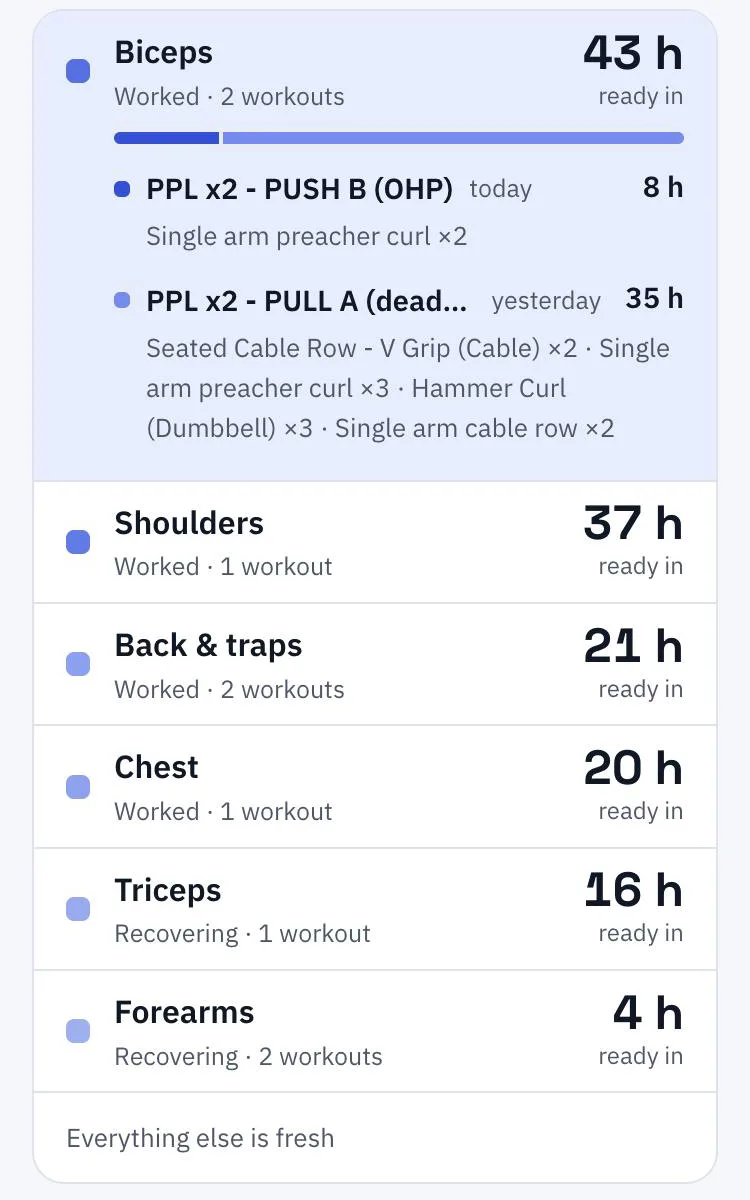
| Biceps | 49.8 | Worked | 43 h | Pull day 35 · push day 8 |
| Shoulders | 44.6 | Worked | 37 h | Push day 37 |
| Back & traps | 28.3 | Worked | 21 h | Pull day 19 · push day 2 (light) |
| Chest | 27.5 | Worked | 20 h | Push day 20 |
| Triceps | 23.5 | Recovering | 16 h | Push day 16 |
| Forearms | 9.4 | Recovering | 4 h | Pull day 3 · push day 1 |
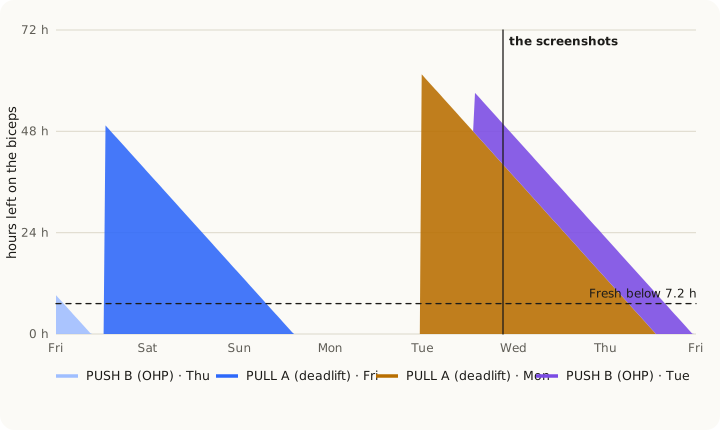
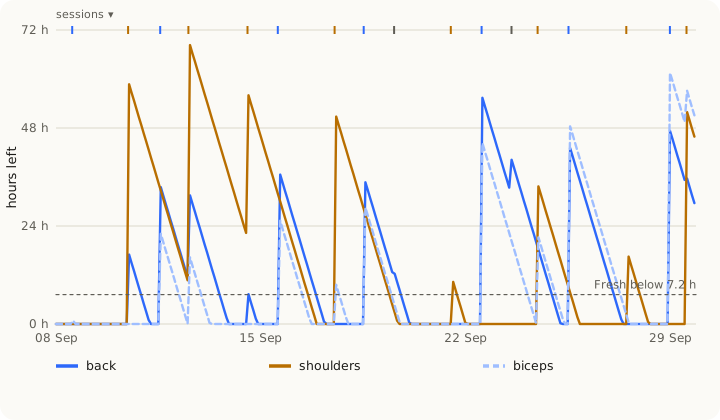
Across six weeks of the same log (28 sessions, 20 August – 29 September), the back and biceps were Fresh at the start of all 12 pull days, and the chest and triceps at the start of all 14 push days. The shoulders were the exception twice (10 and 21 hours left, both "Recovering"), in a week with three push days in five days.
What an unlogged class changes. The same lifter trains kickboxing or MMA twice a week, but those classes weren't in the log. Had the kickboxing class above (pads and bag at RPE 8) been logged on Monday at 19:00, the triceps would have read 41.9 hours right after Tuesday's push day instead of 30.0, the shoulders 56.3 instead of 51.1, and the whole-body score below would have been 73 instead of 63. The model can only count what the log holds.
Nervous system: whole-body training load
Why "load", not "CNS fatigue"
After heavy squats (10 × 5 at 80% of 1RM), strength stayed reduced for up to 72 hours while voluntary activation — the measure of central fatigue — was barely affected; the lasting deficit was peripheral, in the muscle (Thomas et al., 2018; Carroll et al., 2017). So Sparlift doesn't claim to measure a neural state. "Nervous system" is whole-body training load compared with your own usual, the way sports science monitors athletes.
Session load
Session load follows Foster's session-RPE method — effort × minutes, in arbitrary units (AU) — which is valid and reliable across many sports, combat sports included (Haddad et al., 2017).
Load = RPE_session × minutes × (0.8 + 0.4 × systemic load)
RPE of a lifting set = 3 + 7 × h          (half effort or less reads 3, a set to failure 10)
RPE of a round       = logged RPE, else 3 + 5 × systemic load
RPE_session          = mean over sets (rounds weighted by minutes)
minutes              = the logged duration (5–240 min), else 2.5 per set + 4/3 × round minutes + 5
The systemic factor runs from 0.8 (curls) to 1.2 (deadlifts): heavy compound work costs more than the same minutes of isolation. The session's effort is shown in words: light under 5, moderate under 7.5, hard above.
Your usual, and the score
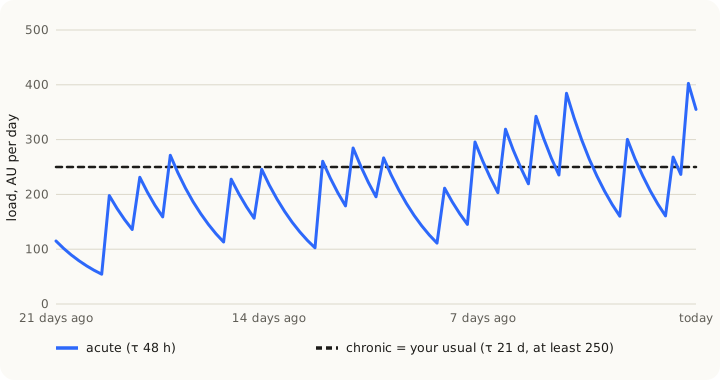
acute   = Σ Load × e^(−age / 48 h)   scaled to AU per day
chronic = Σ Load × e^(−age / 21 d)   scaled to AU per day, at least 250
ratio   = acute / chronic
score   = 100 × (1 − 2^(−ratio))
Both averages are divided by the share of their full weight that the history covers (a bias correction, as in the Adam optimiser), so a short history doesn't read low. This is the fitness–fatigue family of models (Banister; the performance-manager chart) in its exponentially weighted form. The acute:chronic ratio as an injury predictor is heavily criticised (Impellizzeri et al., 2020), and Sparlift never uses it that way: the labels only say how today compares with your usual.
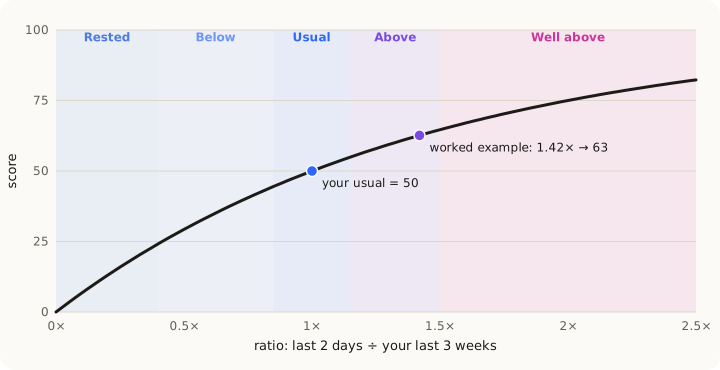
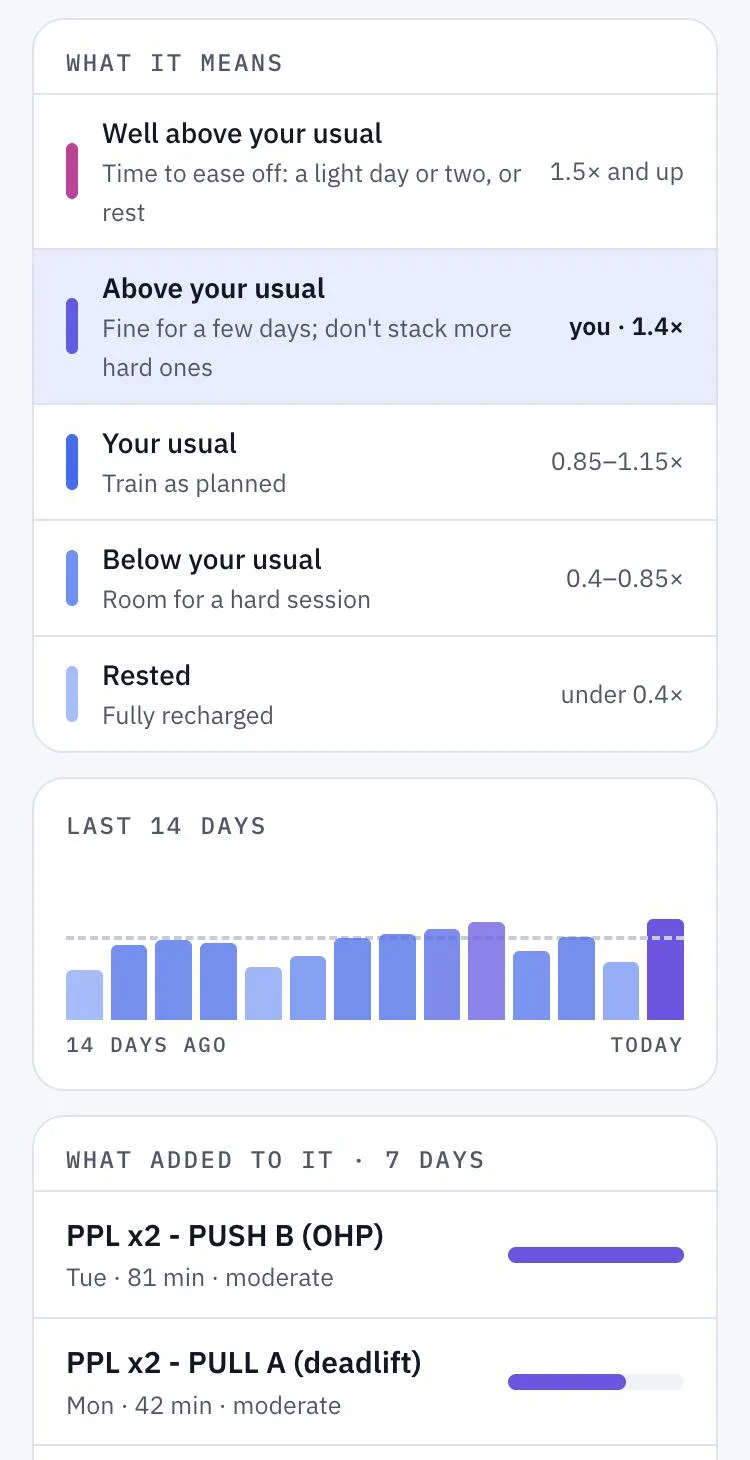
| Ratio | Label | What it means |
|---|---|---|
| 1.5× and up | Well above your usual | Time to ease off: a light day or two, or rest |
| 1.15–1.5× | Above your usual | Fine for a few days; don't stack more hard ones |
| 0.85–1.15× | Your usual | Train as planned |
| 0.4–0.85× | Below your usual | Room for a hard session |
| under 0.4× | Rested | Fully recharged |
Back to your usual. When the ratio is 1.15 or more, the engine steps both averages forward an hour at a time with nothing more logged, and reports the first hour the ratio drops under 1.15. The acute average falls faster than the chronic one, so rest always brings it back.
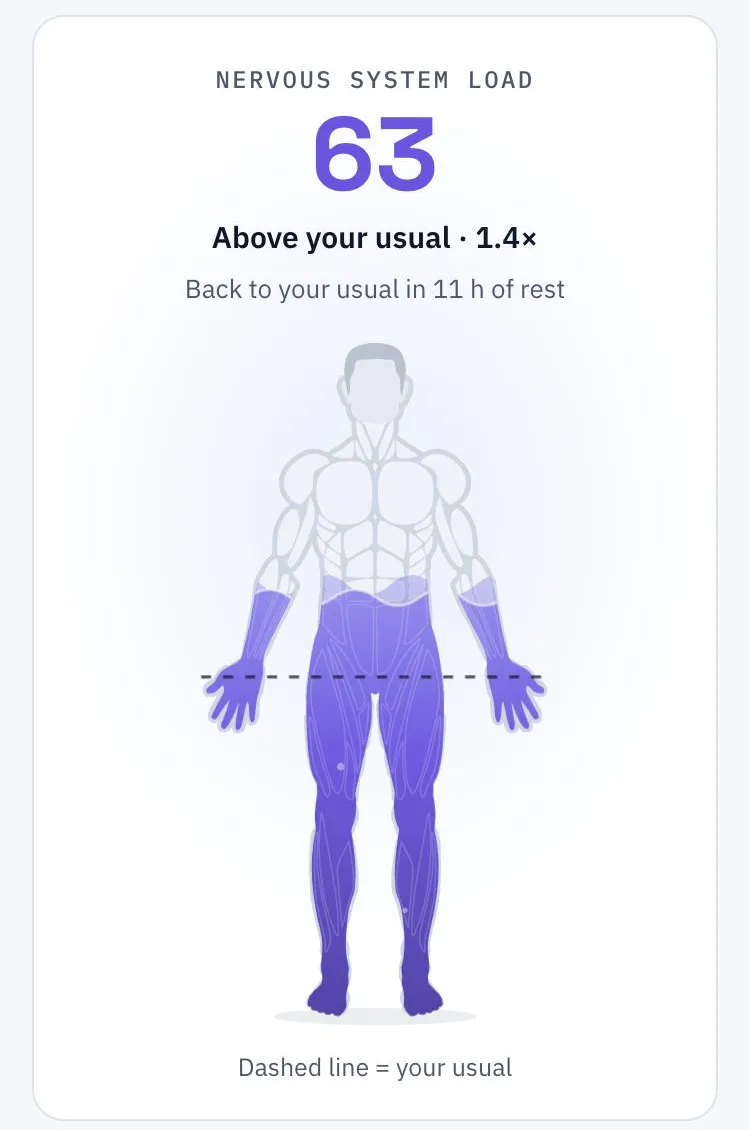
In the worked example the score is 63 — "Above your usual", a ratio of 1.42, back under 1.15 after 11 hours of rest. The acute load was 355 AU a day against a usual of 250, which is the model's floor: with only the lifting in the log, this lifter's usual never rose above it. The push day added the most (81 minutes, RPE 5.4, 402 AU).
Common questions
How long do biceps take to recover?
About 48 hours after three sets of curls taken to failure; less when the sets stop a few reps short. Rows and pulldowns add half their hard sets to the biceps, so a pull day with curls often leaves them 50–60 hours, as in the worked example (61.6 hours from one pull day).
How long does the chest take to recover?
About 48 hours after three hard sets of pressing. In the worked example, three sets of incline press — the last one to failure — left the chest 35 hours.
How long do legs take to recover?
Longer: Sparlift uses 60 hours for quads and hamstrings after three hard sets, and up to 90 hours after a high-volume leg day taken close to failure.
Is 48 hours enough rest between workouts for the same muscle?
After a normal session of about three hard sets, usually yes. After eight or more hard sets close to failure, recovery can take up to about 72 hours; sets stopped well short of failure often recover within a day.
Does the model know when I'm sore?
No. It estimates when a muscle performs again. Delayed-onset soreness peaks around 48 hours and can outlast "Fresh", especially in the first weeks of a new exercise (review).
Limits
- Population values, not yours. T_ref, the hard-set curve and the combat factor are defaults from group studies. Recovery varies between people, with age, sleep and training history.
- Readiness, not soreness. The clock estimates when a muscle performs again, not when it stops feeling sore.
- Nothing outside the log. Sleep, stress, nutrition and training you didn't log aren't seen — as the unlogged kickboxing classes in the worked example show.
- Unmarked sets are estimates. Sets without RIR are judged against your best set; with no history at all, a set counts as taken to failure, so the first weeks read cautious.
- Short histories. With less than six weeks of logs, your usual is still settling: read the nervous-system score as provisional.
- Not validated against outcomes. The model combines published findings; it hasn't been tested against measured performance in Sparlift users. It is orientation for planning, not a medical assessment.
The reasoning behind these choices, with more from the same training log: A muscle recovery tracker built from my own log.
References
- Bartolomei S. et al. (2017). Comparison of the recovery response from high-intensity and high-volume resistance exercise in trained men. European Journal of Applied Physiology. Link
- Carroll T. J. et al. (2017). Recovery of central and peripheral neuromuscular fatigue after exercise. Journal of Applied Physiology. Link
- Falvo M. J. et al. (2008). Repeated bout effect is absent in resistance trained men: an electromyographic analysis. Journal of Electromyography and Kinesiology. PMC
- Haddad M. et al. (2017). Session-RPE method for training load monitoring: validity, ecological usefulness, and influencing factors. Frontiers in Neuroscience. PubMed
- Halperin I. et al. (2022). Accuracy in predicting repetitions to task failure in resistance exercise: a scoping review and exploratory meta-analysis. Sports Medicine 52:377–390. PubMed
- Helms E. R. et al. (2016). Application of the repetitions in reserve-based RPE scale for resistance training. Strength and Conditioning Journal. PubMed
- Impellizzeri F. M. et al. (2020). Acute:chronic workload ratio: conceptual issues and fundamental pitfalls. International Journal of Sports Physiology and Performance. Link
- Kirk C. et al. (2021). Quantification of training load distribution in mixed martial arts athletes: a lack of periodisation and load management. PLOS One 16(5). Link
- Miller B. F. et al. (2005). Coordinated collagen and muscle protein synthesis in human patella tendon and quadriceps muscle after exercise. Journal of Physiology. PubMed
- Morán-Navarro R. et al. (2017). Time course of recovery following resistance training leading or not to failure. European Journal of Applied Physiology. Link
- Pareja-Blanco F. et al. (2019). Time course of recovery following resistance exercise with different loading magnitudes and velocity loss in the set. Sports 7(3):59. doi:10.3390/sports7030059
- Soares S. et al. (2015). Comparison of muscle damage after multi-joint and single-joint exercises. Journal of Strength and Conditioning Research. PubMed
- Thomas K. et al. (2018). Neuromuscular fatigue and recovery after heavy resistance, jump, and sprint training. Medicine & Science in Sports & Exercise. PubMed
- Zourdos M. C. et al. (2016). Novel resistance training–specific rating of perceived exertion scale measuring repetitions in reserve. JSCR 30(1):267–275. PubMed